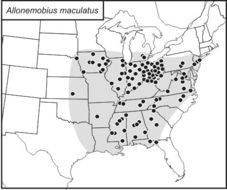
Version of manually-generated dot map displayed above, showing U.S. and Canadian records, was harvested from SINA on Aug-05-2018.Dots show county records; shaded area shows likely general distribution.
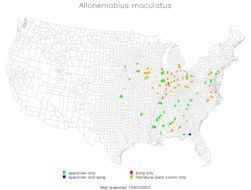
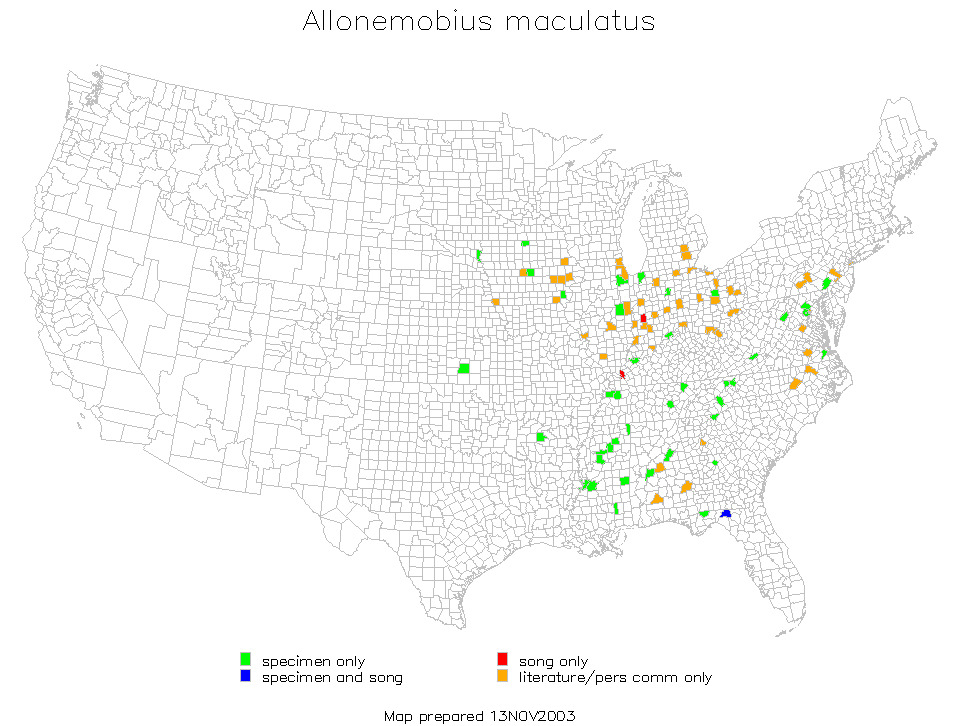
See also this computer-generated U.S. distribution map, produced in 2003 from records in a
database available on the Singing Insects of North America site. The group of three county records in extreme northeast Ohio is documented in this
map by
Lisa Rainsong.

