-
Robert Hershler, Victoria Ratcliffe, Hsiu-Ping Liu, Brian Lang, Claire Hay
Zookeys
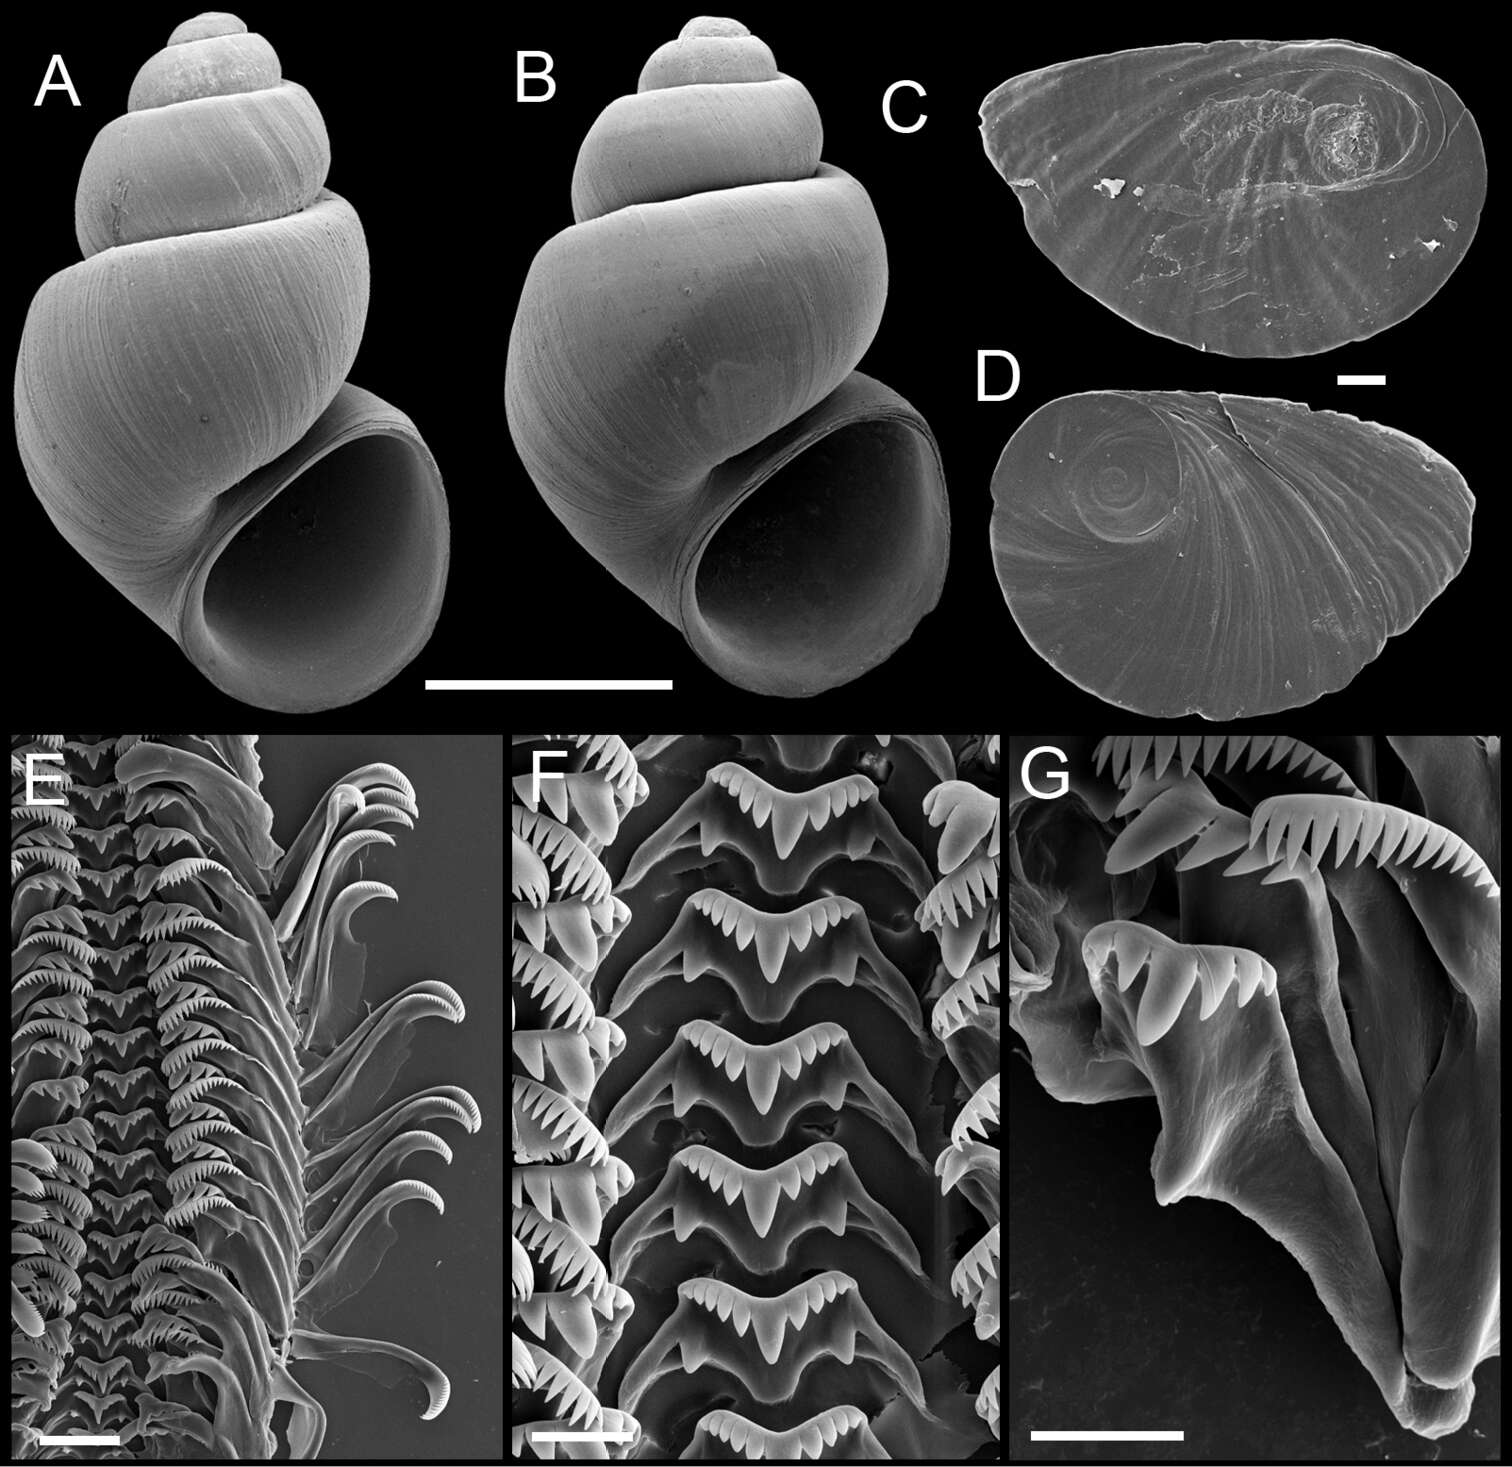
Figure 3.Shells, opercula and radula, Pyrgulopsis marilynae n. sp. A Holotype, USNM 1135068 B Shell, USNM 1135067 C, D Opercula (outer, inner sides), USNM 1135067 E Portion of radular ribbon, USNM 1135067 F Central teeth, USNM 1135067 G Lateral and inner marginal teeth, USNM 1135067. Scale bars A, B 1.0 mm; C, D 100 µm; E 20 µm, F, G 10 µm.
-
Robert Hershler, Victoria Ratcliffe, Hsiu-Ping Liu, Brian Lang, Claire Hay
Zookeys
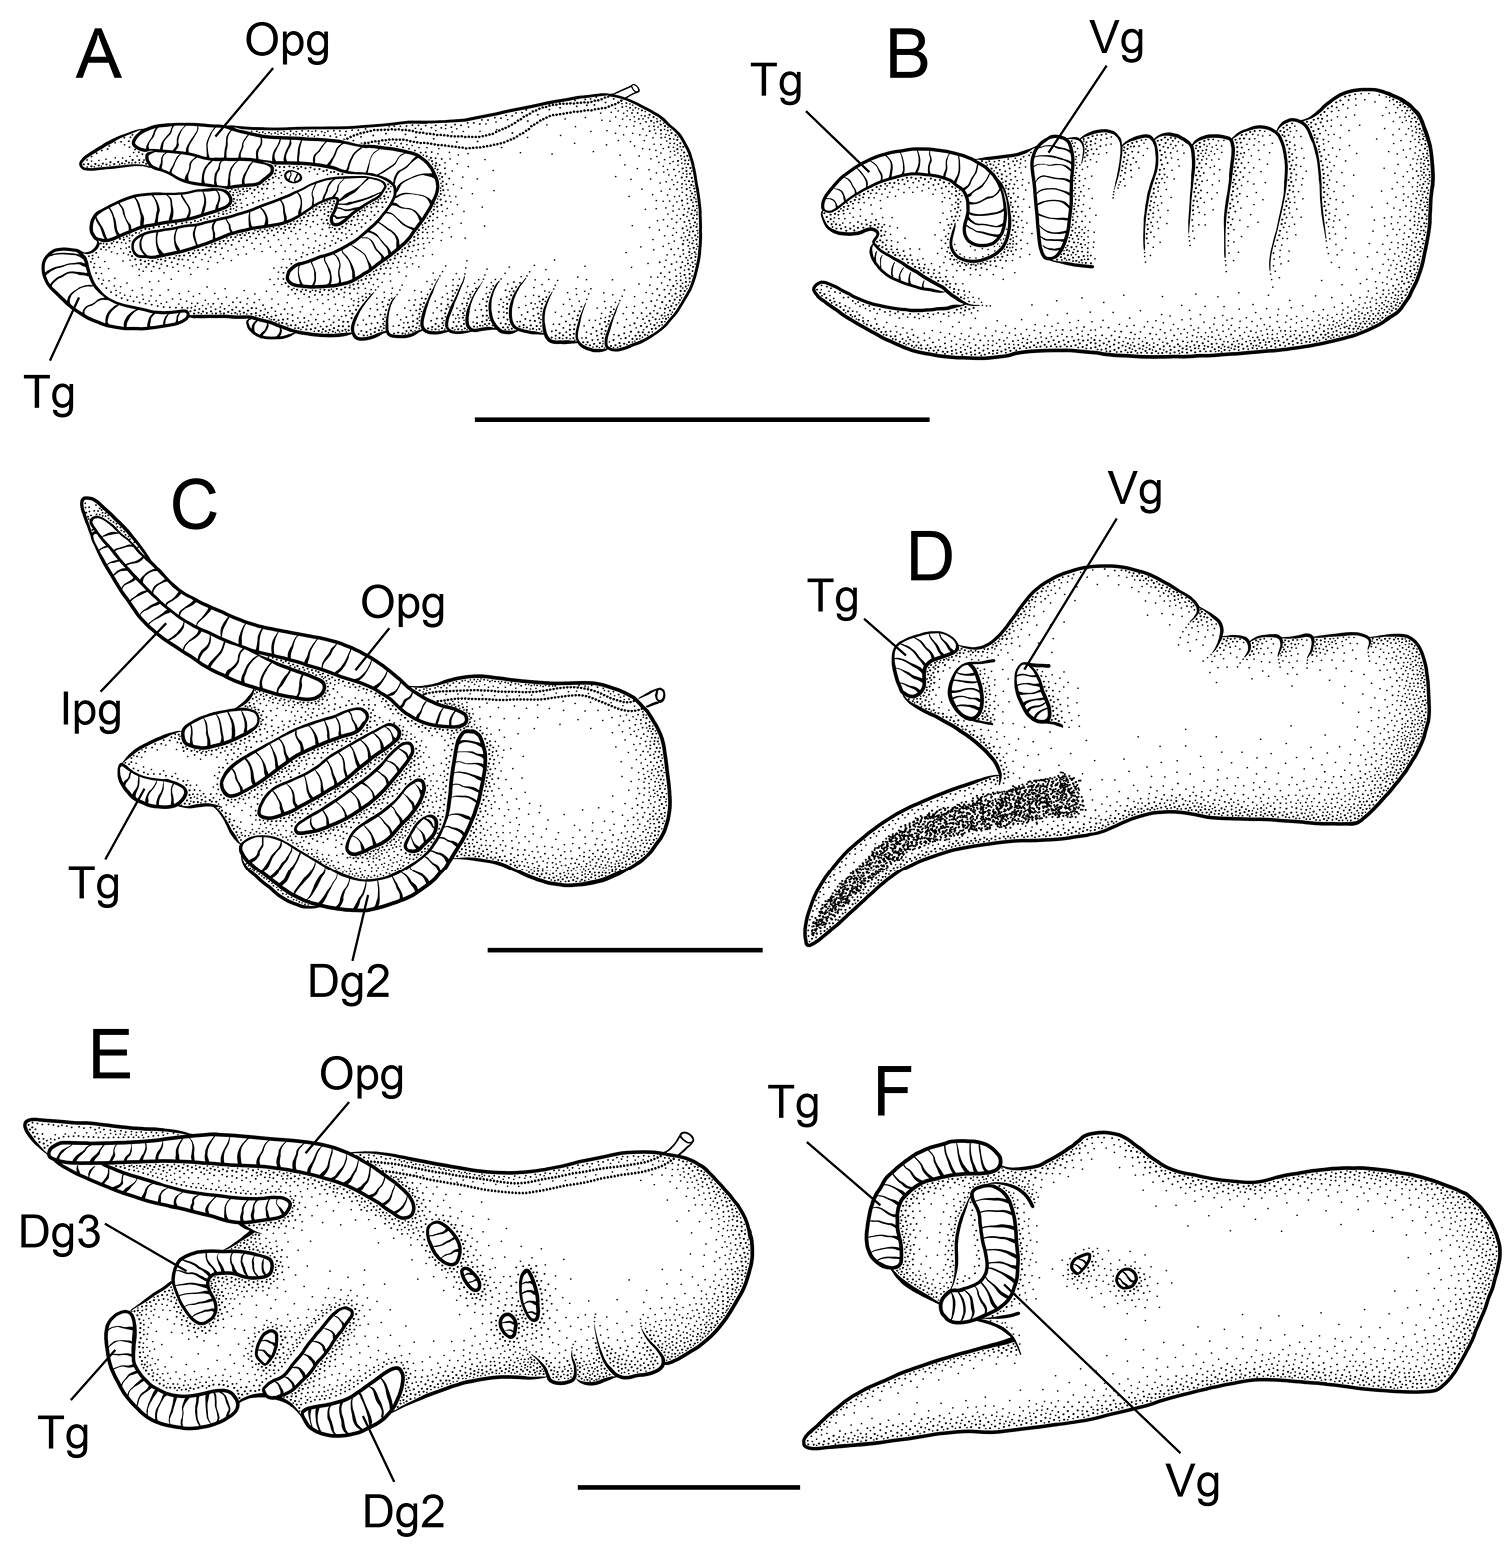
Figure 4.Penes (dorsal, ventral surfaces). A, B Pyrgulopsis marilynae n. sp., USNM 883175 C, D Pyrgulopsis similis n. sp., USNM 1135065 E, F Pyrgulopsis gilae, BellMNH 20898. Scale bars A–F 200 µm. Dg2 dorsal gland along left edge Dg3 dorsal gland along right distal edge Ipg inner (left) penial gland Opg outer (right) penial gland Tg terminal gland Vg ventral gland.
-
Robert Hershler, Victoria Ratcliffe, Hsiu-Ping Liu, Brian Lang, Claire Hay
Zookeys
Figure 1.Map showing the distribution of mtDNA clades I-III.
-
Robert Hershler, Victoria Ratcliffe, Hsiu-Ping Liu, Brian Lang, Claire Hay
Zookeys
Figure 2.Bayesian tree based on the combined (COI, NDI) dataset. Posterior probabilities for nodes are given when >95%. Specimen codes are from the Table 1.
-
Robert Hershler, Victoria Ratcliffe, Hsiu-Ping Liu, Brian Lang, Claire Hay
Zookeys
Figure 4.Penes (dorsal, ventral surfaces). A, B Pyrgulopsis marilynae n. sp., USNM 883175 C, D Pyrgulopsis similis n. sp., USNM 1135065 E, F Pyrgulopsis gilae, BellMNH 20898. Scale bars A–F 200 µm. Dg2 dorsal gland along left edge Dg3 dorsal gland along right distal edge Ipg inner (left) penial gland Opg outer (right) penial gland Tg terminal gland Vg ventral gland.
-
Robert Hershler, Victoria Ratcliffe, Hsiu-Ping Liu, Brian Lang, Claire Hay
Zookeys
Figure 5.Shells, opercula and radula, Pyrgulopsis similis n. sp. A Holotype, USNM 1135064 B Shell, USNM 854684 C, D Opercula (outer, inner sides), USNM 1135065 E Portion of radular ribbon, USNM 1135065 F Central teeth, USNM 1135065 G Lateral and inner marginal teeth, USNM 1135065. Scale bars A, B 1.0 mm; C, D 200 µm; E 20 µm, F, G 10 µm.
-
Robert Hershler, Victoria Ratcliffe, Hsiu-Ping Liu, Brian Lang, Claire Hay
Zookeys
Figure 1.Map showing the distribution of mtDNA clades I-III.
-
Robert Hershler, Victoria Ratcliffe, Hsiu-Ping Liu, Brian Lang, Claire Hay
Zookeys
Figure 2.Bayesian tree based on the combined (COI, NDI) dataset. Posterior probabilities for nodes are given when >95%. Specimen codes are from the Table 1.
-
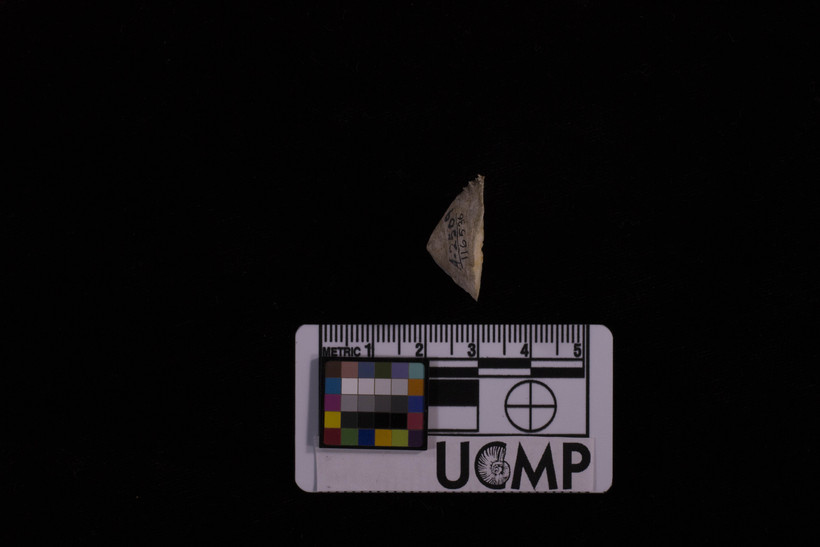
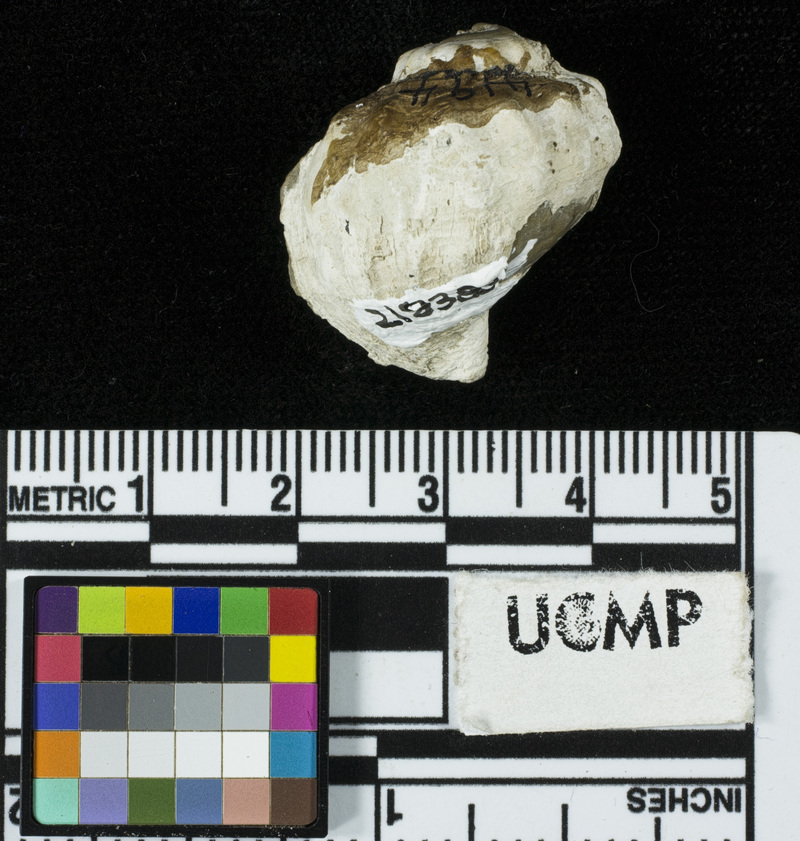
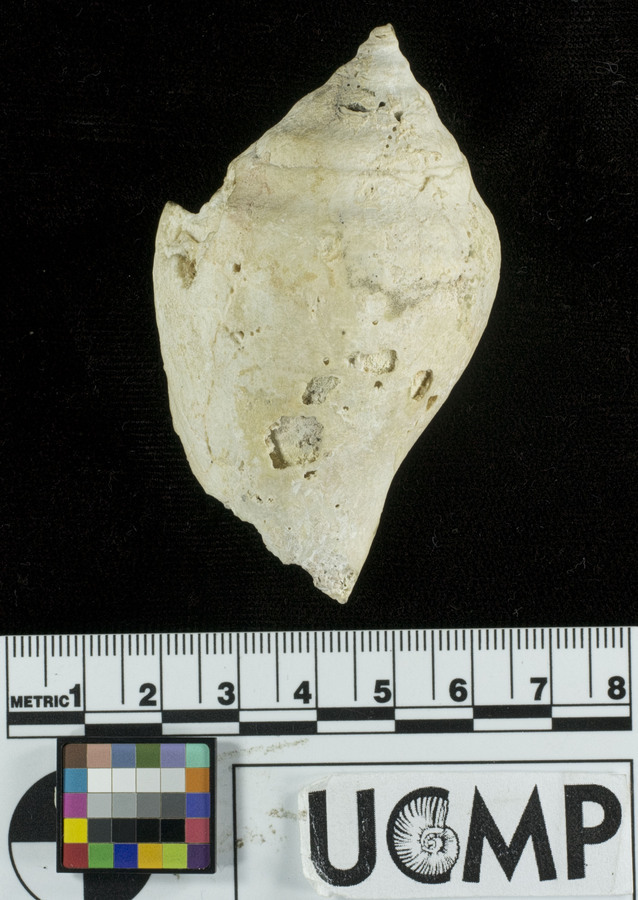
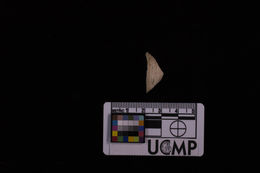
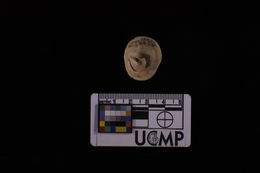
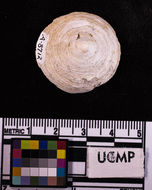
2017 University of California Museum of Paleontology
CalPhotos
-
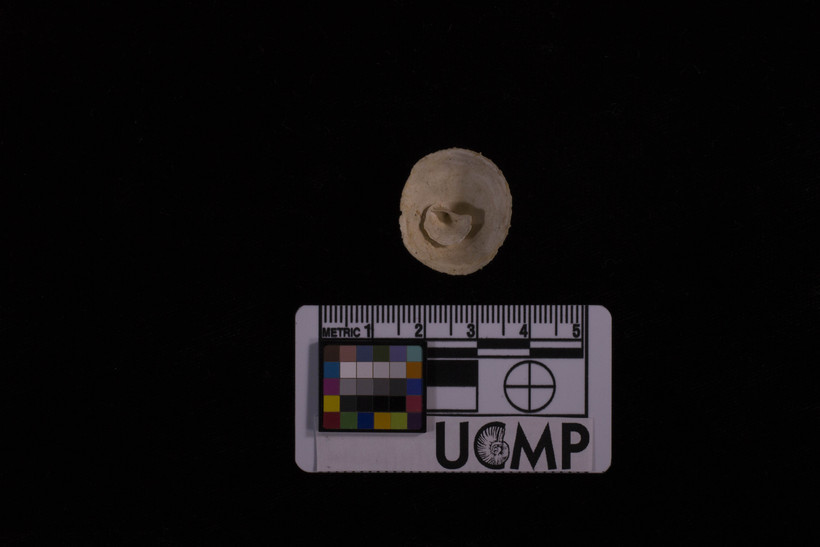
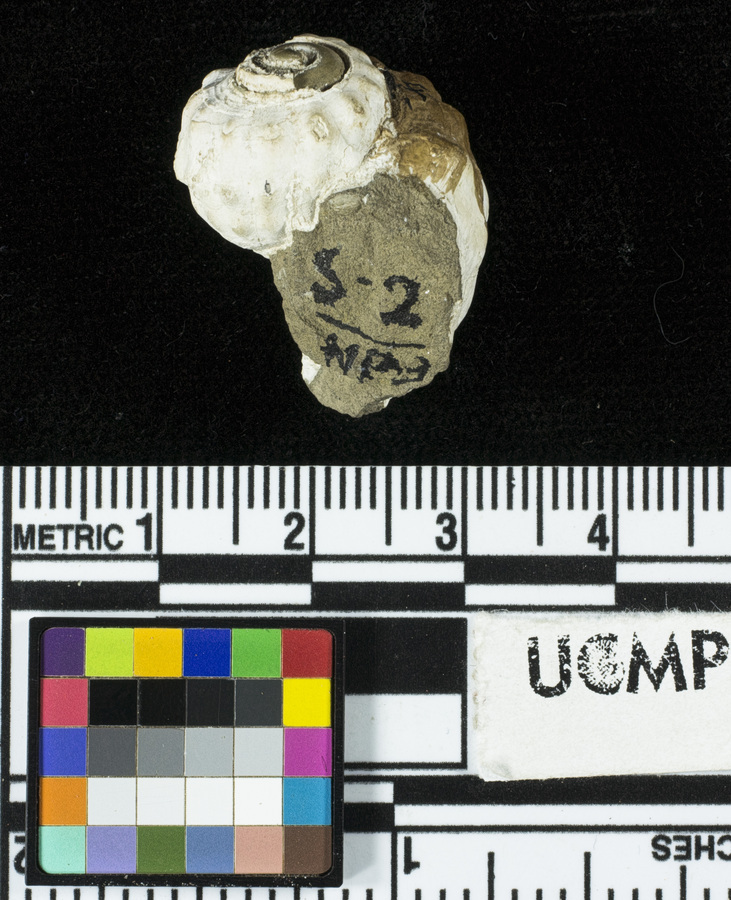
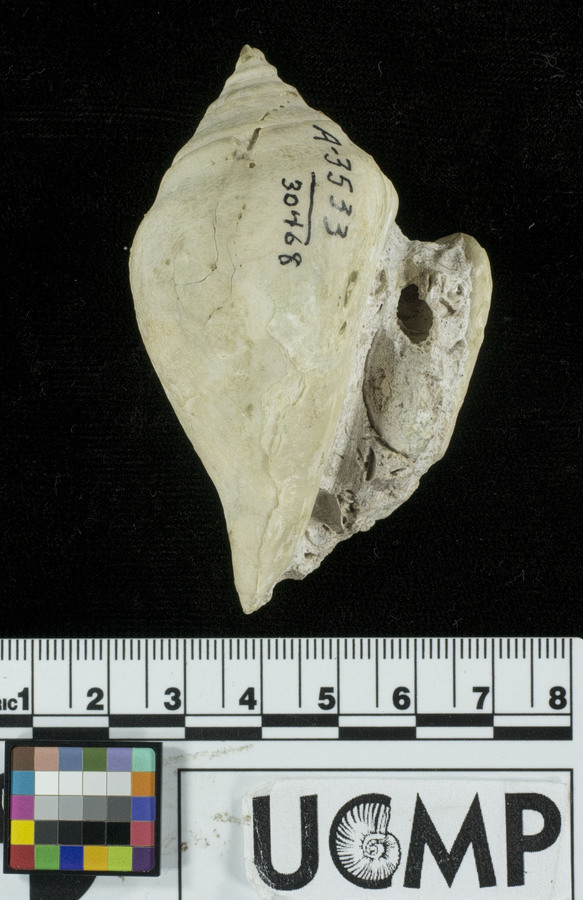
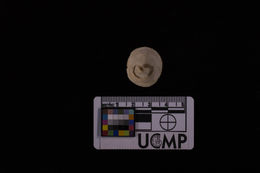
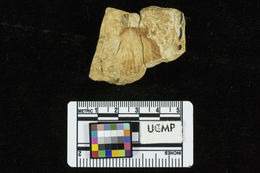
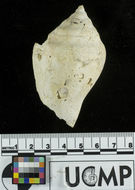
2017 University of California Museum of Paleontology
CalPhotos
-
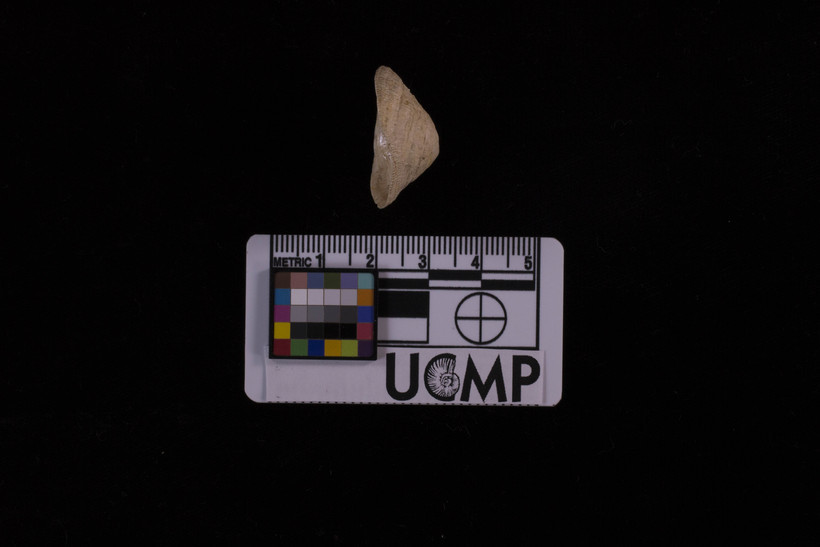
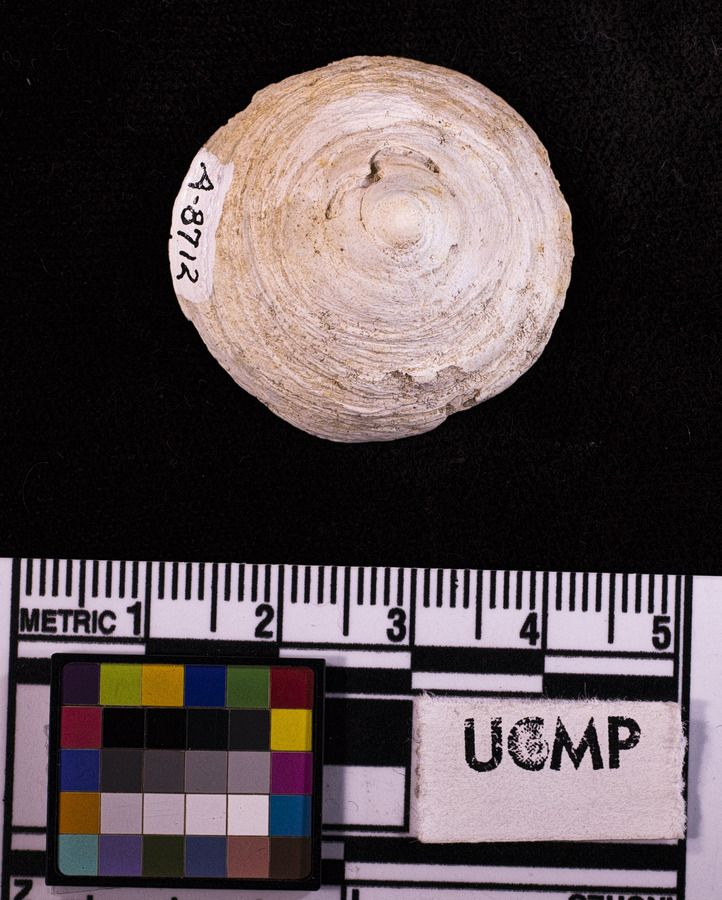
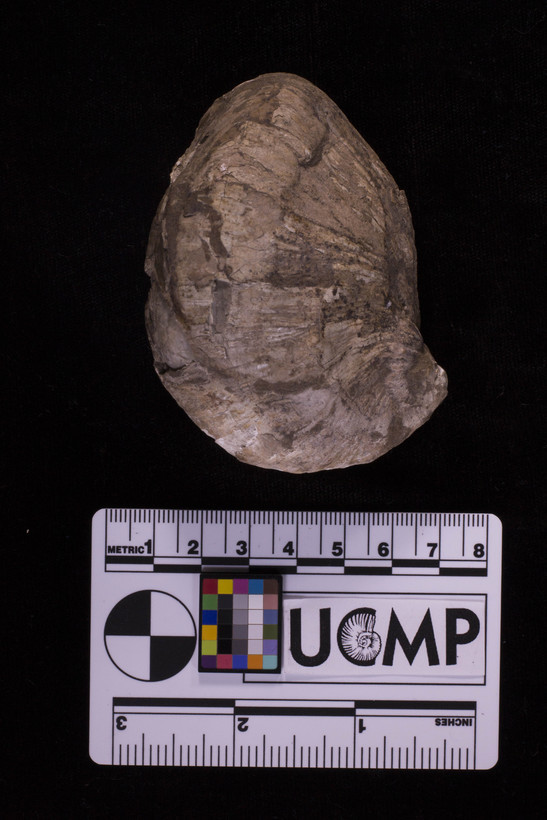
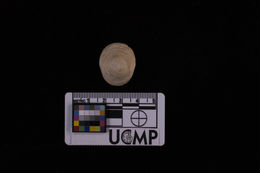
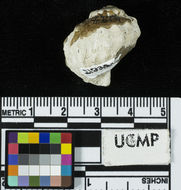
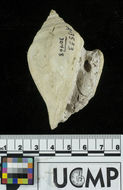
2017 University of California Museum of Paleontology
CalPhotos
-
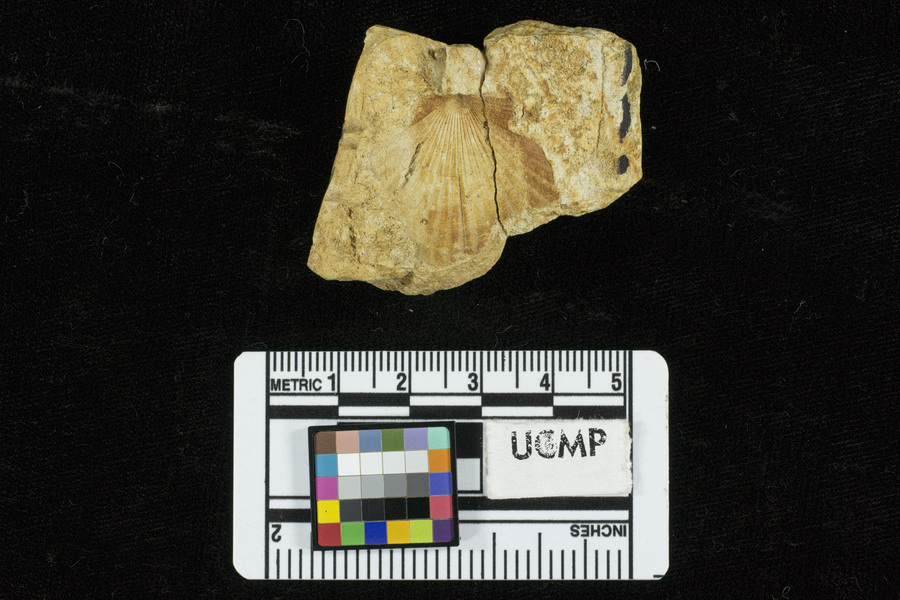
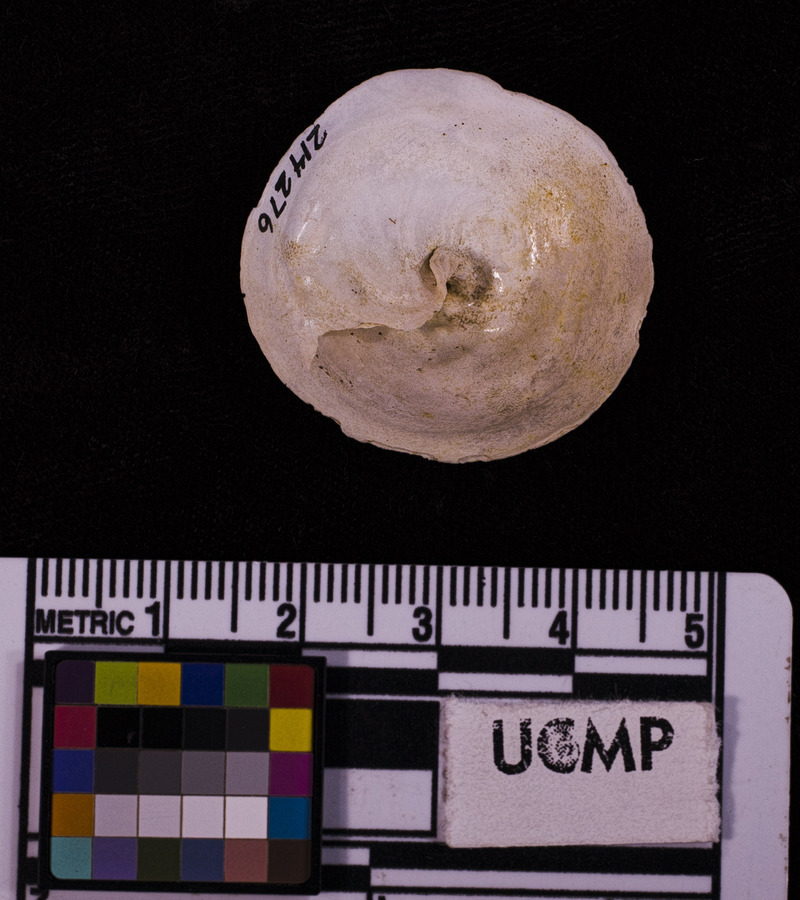
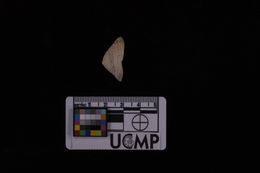
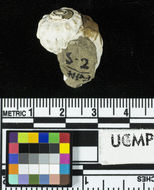
2017 University of California Museum of Paleontology
CalPhotos
-
2017 University of California Museum of Paleontology
CalPhotos
-
2017 University of California Museum of Paleontology
CalPhotos
-
2017 University of California Museum of Paleontology
CalPhotos
-
2017 University of California Museum of Paleontology
CalPhotos
-
2018 University of California Museum of Paleontology
CalPhotos
-
2018 University of California Museum of Paleontology
CalPhotos
-
2018 University of California Museum of Paleontology
CalPhotos
-
2018 University of California Museum of Paleontology
CalPhotos
-
2018 University of California Museum of Paleontology
CalPhotos
-
2018 University of California Museum of Paleontology
CalPhotos
-
2018 University of California Museum of Paleontology
CalPhotos
-
2017 University of California Museum of Paleontology
CalPhotos